The Reports page opens with a snapshot of your business, then lets you run three detailed reports. Each report filters by client and date range, and you can download the result as a CSV file.
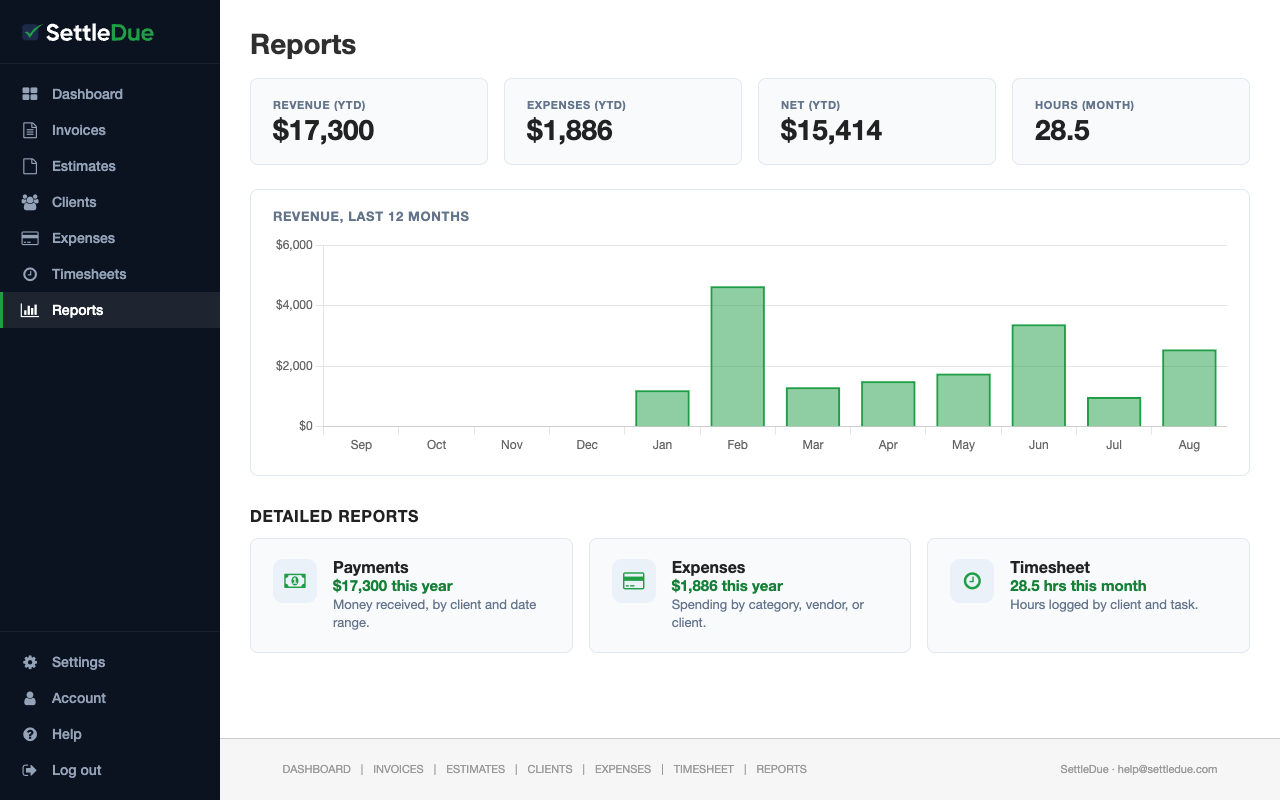
The Reports page shows a summary and a card for each report.
Open the Reports page
Click Reports in the navigation bar.
At the top you see four totals for the current period: Revenue, Expenses, Net, and Hours, plus a revenue chart for the last 12 months.
Below the chart, click one of the three report cards:
Payments: money you have collected, by client and date range.
Expenses: money you have spent, by category, vendor, or client.
Timesheet: hours you have logged, by client and task.
Run a report
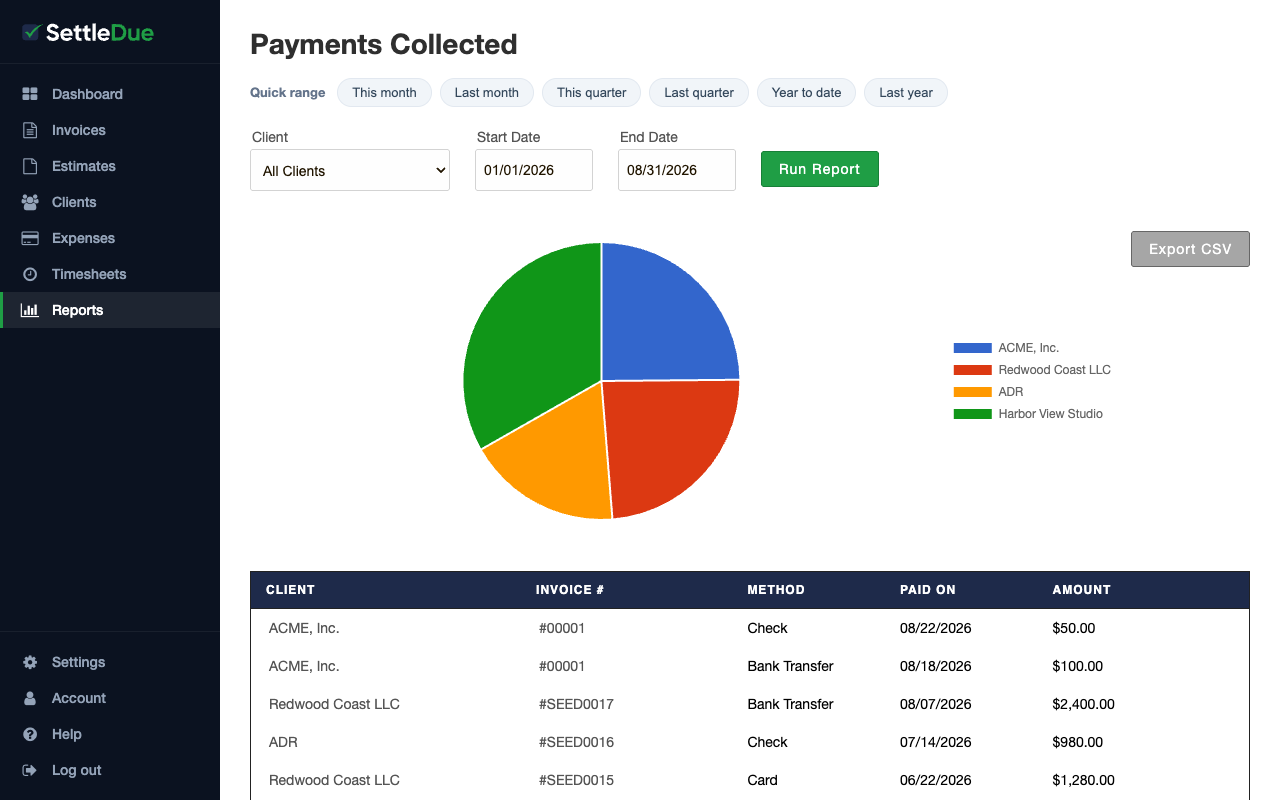
Click a Quick range button (This month, Last month, This quarter, Last quarter, Year to date, or Last year) to set the dates and run the report in one step.
Or set the range yourself: choose a Client or leave it on All Clients, enter a Start Date and an End Date, then click Run Report. Leave both dates empty to include all dates.
Use the This quarter and Last quarter buttons to jump to a period without typing dates.
Use the quick range buttons, then download the result with Export CSV.
Export a report
Run the report for the range you want.
Click Export CSV at the top of the results.
Your browser downloads a CSV file of the rows. Send it to your accountant, or open it in a spreadsheet.